To access Insights, go to https://insights.carexm.com
You will use the same login information that you use to access CXM to log into Insights. This means that if you change your CXM password, it will update in Insights as well.
Your CXM user must have the Analytics toggle turned ON in order to log into Insights.
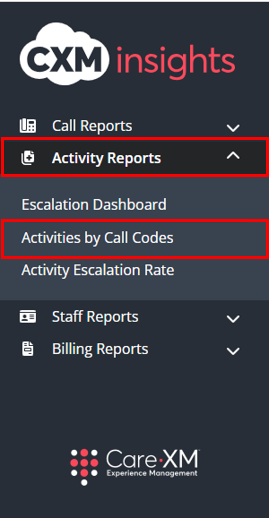
Once logged in, you will be on the landing page and can choose from the different reports by hovering over the category in the left side bar:

Choose Activity Reports then "Activities by Call Codes":
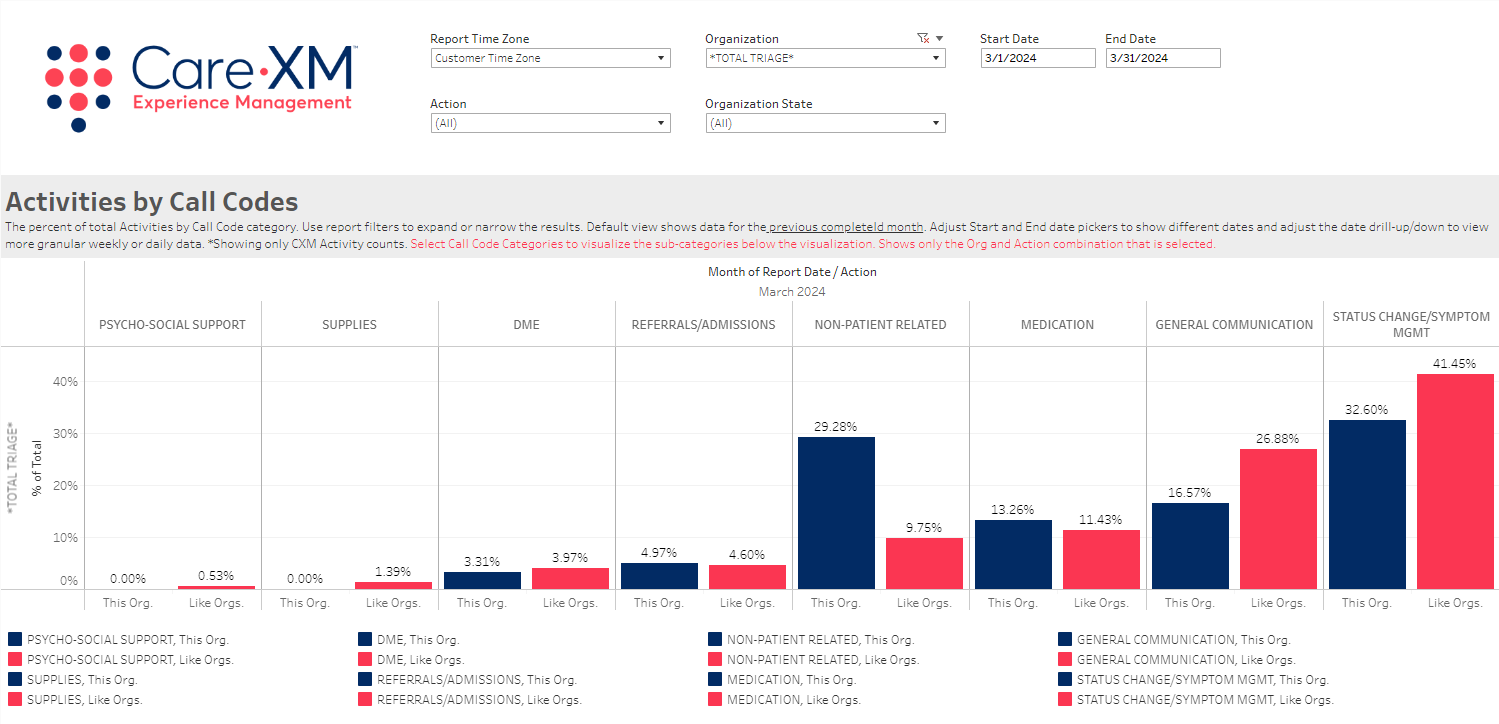
This report can be filtered by Report Time Zone, Organization, Date Range, Action, and Organization State:

- Report Time Zone: The report will process the data in the user's time zone, to switch time zones, click on the drop down and choose the correct option.
- Organization: This filter allows the user to select the organization(s) for which they want to see data. Only Organization(s) that the user has access to AND that have data in the selected time frame will be shown in the filter options.
- Date Range: The default date range will display as the previous month. The date can be changed to any date range, within the previous 13 months. To look up a specific date range, manually enter the date.
- Action: This filter allows user to select specific Call Code categories. Defaults to "All".
- Organization State: This filter allows users to filter the list of Organizations down to those located in the selected geographical state(s). By default, all Organization States will be selected.
Note: For report to filter correctly, click on the "Apply" button on the bottom of each filter's drop down. Only applies if the list exceeds 10 options.

Each column displays a call code category. The percentage on the left side of each column displays your organization's percentage. The percentage on the right side of each column displays all of the other CareXM client's data. You can compare how your organization compares with other like organizations nationwide:
Click on the column to highlight that columns data:

An underlying report is viewed by clicking on the category column in the original chart and a second window will open below with the breakout of codes in that category.
- If you want to select multiple categories at the same time can use CTRL + click to select multiple
- the secondary data can be downloaded the same way as all other charts

The Zoom feature is located on the top left column and only appears when you hover over it. This feature allows the data to be viewed by day/week/month/quarter or year:

The report can be downloaded, select "Download" in the lower right hand corner of the screen, click the name of your organization on the left side of the screen to highlight it in blue and click "download" in the lower right corner of the screen:

Click to turn the organization name blue

Then download:

Choose your file format:

Related Articles