To access Insights, go to https://insights.carexm.com
You will use the same login information that you use to access CXM to log into Insights. This means that if you change your CXM password, it will update in Insights as well.
Your CXM user must have the Analytics toggle turned ON in order to log into Insights.
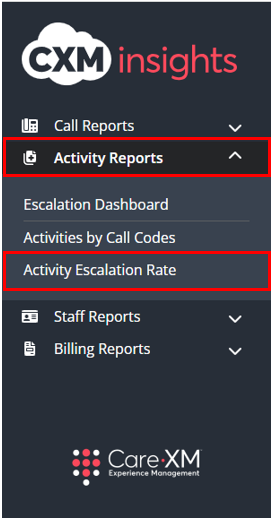
Once logged in, you will be on the landing page and can choose from the different reports by hovering over the category in the left side bar:

Choose “Activity Reports”, then “Activity Escalation Rate”.
The Activity Escalation Rate report looks at the Follow-up Notes or Activity Events on each activity to determine if an Activity was escalated instead of relying on the Activity Status. This logic defines that any activity with at least one contact attempt to Client Staff was an ‘Escalated Activity’.

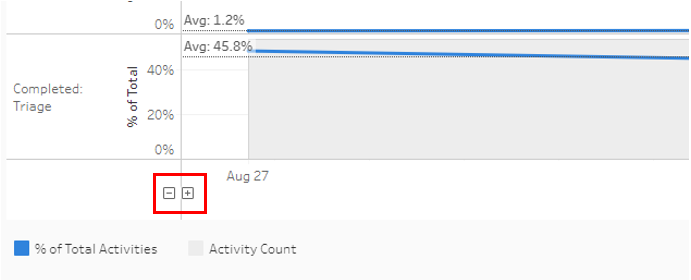
- The Blue Line shows the percentage of Activities that resulted in the Activity Status shown on the left.
- The Grey columns show the count of Activities.
- The (dotted) Average line shows the average percentage of that Activity Status over the selected time period.
- The Activity Statuses shown are shown from top to bottom from the higher impact to Client Staff to the lowest impact to client staff.
- Grand Total – Used to show grand total of activities.
- Completed: Requested/Offered Visit – Used when the nurse or agent contacted on-call staff regarding a visit, whether it was requested or offered.
- Completed: Staff Contact – Used when the nurse or agent needs to contact the on-call staff to obtain information that resolves the caller’s needs, but does not transfer or delegate that responsibility to the on-call staff.
- Completed: Triage – Used when the nurse or agent resolved the caller’s needs without needing to contact a staff member listed on the on-call calendar.
- Completed: Referred to 911/ER – Used when the nurse or agent contacted the on-call staff to inform about patient being referred to or voluntarily contacted/will contact 911 or visit the ER.
- Completed – Used when the activity has been successfully completed and patient needs were taken care of.
This report can be filtered by Report Time Zone, Organization, Service Type, Organization State, Date Range, Team, and Call Code.

- Report Time Zone: The report will process the data in the user's time zone, to switch time zones, click on the drop down and choose the correct option.
- Organization: This filter allows the user to select the organization(s) for which they want to see data. Only Organization(s) that the user has access to AND that have data in the selected time frame will be shown in the filter options.
- Service type: This filter allows the user to select the type of service for which they want to see data. For example, Home Health Care, Hospice Care, PACE, etc..
- Organization State: This filter allows users to filter the list of Organizations down to those located in the selected geographical state(s). By default, all Organization States will be selected.
- Date Range: This filter allows users to look up a specific date range by manually entering the date.
- Team: This filter allows the user to see only what was created by a specific team. For example, if filtered down to CareTriage, the report would only show data for calls handled by CareTriage.
- By default, this filter will include all Teams selected. The available options shown will be only those relevant to the Organization(s) selected.
- Team Definitions:
- CareAssist - The CXM Non-Clinical Team
- CareTriage - The CXM Clinical Team
- CXM App - The Total Triage Mobile app calls
- CXM - The client Enterprise team
- Call Code: This filter allows user to select primary reason for call.
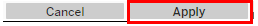
Note: For report to filter correctly, click on the "Apply" button on the bottom of each filter's drop down. Only applies if the list exceeds 10 options.
The visualization can be adjusted to show by day (default), by week, by month, etc. by clicking the -/+ buttons that appear at the bottom of the y axis on the left side of the report.
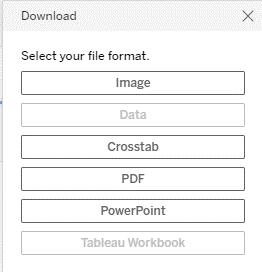
To download, click on "Download", then select your file format: