To access Insights, go to https://insights.carexm.com
You will use the same login information that you use to access CXM to log into Insights. This means that if you change your CXM password, it will update in Insights as well.
Your CXM user must have the Analytics toggle turned ON in order to log into Insights.
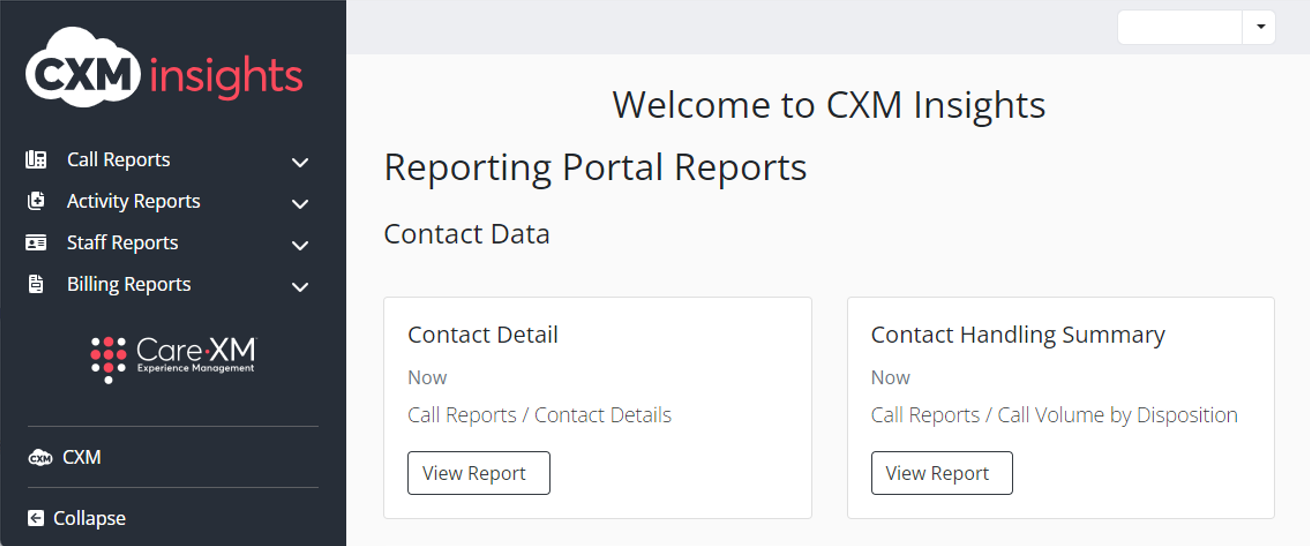
Once logged in, you will be on the landing page and can choose from the different reports by hovering over the category in the left side bar:
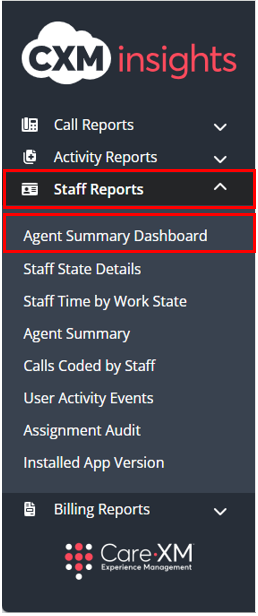
Choose “Agent Summary Dashboard”.
The Agent Summary Dashboard provides visibility into the historical timeline details of users who log into a call center or Desktop Experience to take calls. This dashboard has a variety of tiles with varying degrees of aggregation to allow users to quickly understand what different agents are doing within the call center. This dashboard only shows data for users logging into a call center and does not show data for any users logging into mobile applications.
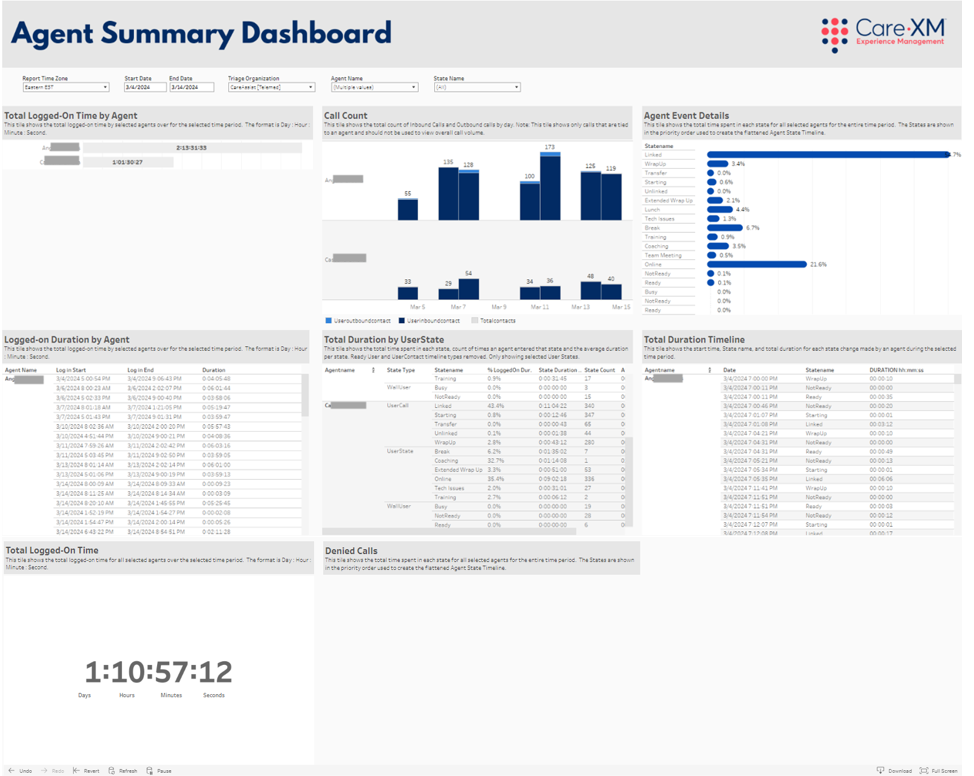
This Report can be filtered by Report Time Zone, Start Date, End Date, Triage Organization, Agent Name, and State Name.
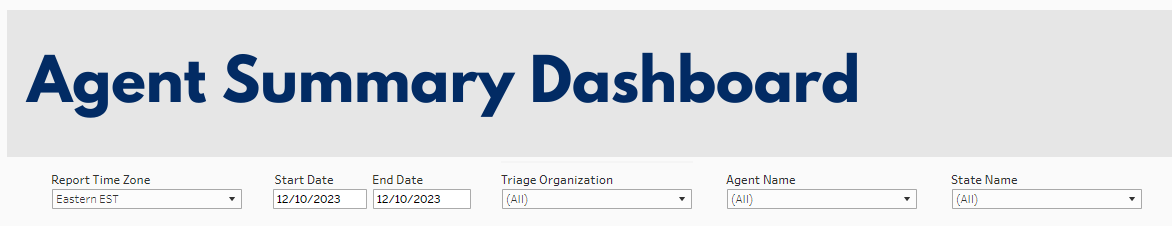
- Report Time Zone – This filter changes all data shown in the report in the selected time zone. This filter defaults to EST.
- Start Date/End Date – This filter allows users to select the date range for the desired data. This filter defaults to the previous 3 days.
- Triage Organization – This filter allows users to select the Call Center the Agents use. This is tied to the organization in CXM where the ACD Agents exist. This defaults to showing all call centers available to the user based on their organization permissions in CXM.
- Agent Name – This filter allows users to filter to select the Agent(s) they want to see in the dashboard. Due to the volume of data available, this defaults to no Agents selected. It is recommended that only a few users are selected at a time to keep the dashboard loading time down.
- State Name – This filter allows users to select the states they want to see on the Agent Event Details and Total Duration Timeline.
- Note: For the Agent Event Details tile, this will adjust the percentage of time spent in state to the percentage for only the selected states.
Note: By default, this dashboard will load with no Agents selected, and will appear blank. If your organization does not have agents logging into a call center, this dashboard will appear with empty tiles.
Note: For report to filter correctly, click on the "Apply" button on the bottom of each filter's drop down. Only applies if the list exceeds 10 options.

This dashboard has a variety of tiles with varying degrees of aggregation to allow users to quickly understand what different users are doing within the call center. This dashboard only shows data for users logging into a call center and does not show data for any users logging into mobile applications.
- Logged-On Time by Agent – This tile shows the total amount of time for in a Days : Hours : Minutes : Seconds format that each agent selected was logged in to the call center or Desktop Experience for the selected time period. This is the total time for all of the different login sessions across the selected time period for each agent.
- Note: In the Days : Hours : Minutes : Seconds format each day counted is the equivalent of 24 hours. For example, if the agent worked a total of 26 hours, 36 mins, and 55 seconds, it would reflect on the data as 1:02:36:55.

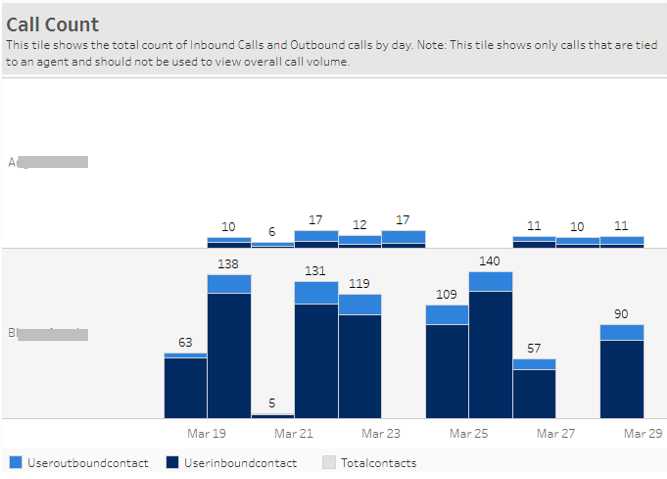
- Call Count – This tile shows the total count of Inbound Calls and Outbound calls by day for each agent. Each agent will be broken out into a separate row.
- Note: This time shows only calls that are tied to an agent and should not be used to view overall call volume.
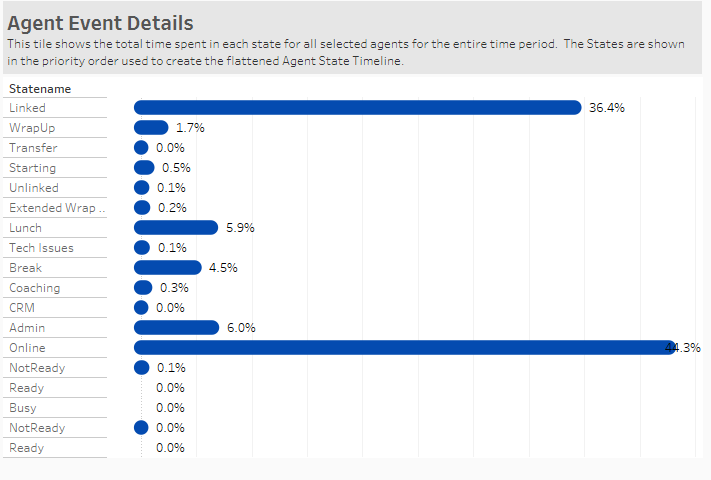
- Agent Event Details – This tile shows the percent of time all the selected agents spent in each state. The on-hover shows the total time spent in each stat in the Days : Hours : Minutes : Seconds format. This tile shows the States based on the priority order used to flatten the data into a single timeline and is not alphabetical.
- Note: the percentages in this tile are based on the states showing in the tile. If there are states being filtered out the percentage will be based only on the visible states.
- Logged-on Duration by Agent – This tile shows the total amount of time logged in by session for each selected agent over the selected time period. Each session is counted from the time the agent logs in to the call center or Desktop Experience until the Agent logs out. Each session is shown on an individual row for each selected user.

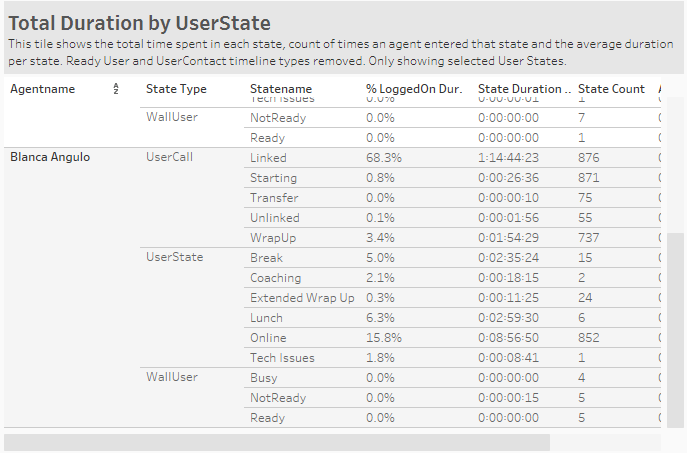
- Total Duration by User State – For each selected agent, this tile shows the following information across the selected time period:
-
- State Type: This is the ‘category’ the states fall into. Each type is listed in the priority sorting order.
- User Call – This is any state directly tied to an agent being on a call. These states are not Agent ‘selectable’, meaning the agent does not choose to go into these states but moves through them during the course of a call. The ‘wrap up’ state shown in this group is the automatic wrap up state added at the end of each call.
- User State – This is any user selectable state. These states are the ones users choose to go in and out of such as Available, Data Entry, Break, etc.
- Wall User – This is the background state of a user when they log in to the call center or desktop experience and is either ‘Ready’ or ‘Not Ready’. This will only show time when an agent is not in any other state.
- State name – This is the name of the state the agent was in.
- % of Total – This is the percentage of time the agent spent in that state over the selected time period.
- State Duration – This is the total time the agent spent in that state over the selected time period. It is shown in a Days : Hours : Minutes : Seconds format.
- State Count – This is the number of times the agent entered that state over the selected time period.
- Average State Duration – This is the average amount of time the agent spent in that state over the selected time period. This is calculated by dividing the State Duration by the State Count.
- State Type: This is the ‘category’ the states fall into. Each type is listed in the priority sorting order.
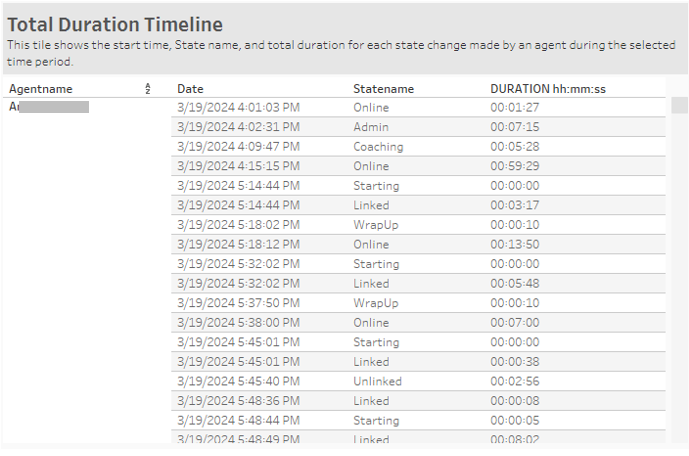
- Total Duration Timeline – This tile shows the timeline of each individual state change with the start time, state name, and duration over the course of the selected time period.
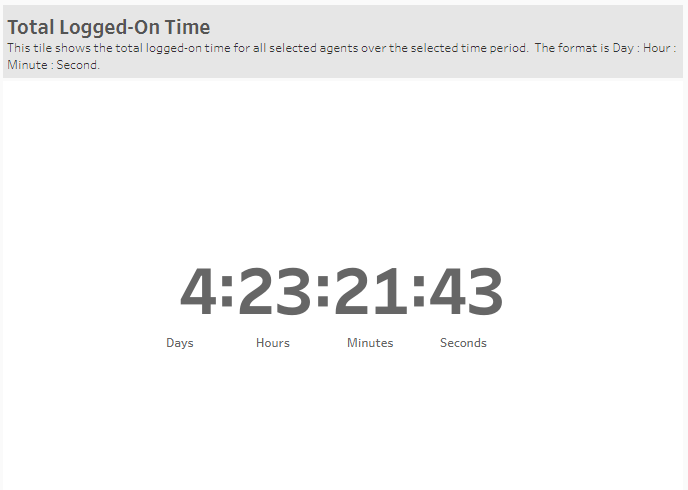
- Total Logged-on Time – This tile shows the total logged-on time for all selected agents over the selected time period. The format is Day: Hour: Minute: Second.
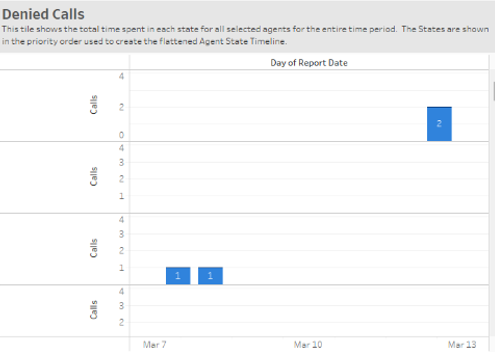
- Denied Calls – This tile shows the count of calls that were Missed or Rejected by Agents in the call center. Each Agent will show on a separate row with the count of Missed calls and the count of Rejected Calls in different colors.
Data Sourcing Note:
The Agent State Dashboard data comes from the user timelines pulled from the call center. That data is then flattened into a single timeline to provide a clean way to provide visibility into the percentage of time agents are spending in specific states without overlapping times that would cause inflated durations. However, due to this adjustment, the start and end times of the Agent state changes, and overall durations will not match the call center data.
For example, when an agent logs in for the day they are flagged as ‘Online’. This state persists throughout the session. For the timeline shown within this dashboard, the ‘Online’ state is only shown when the agent is in no other state. States are prioritized in the following way:
- User Call
- User State
- Wall User
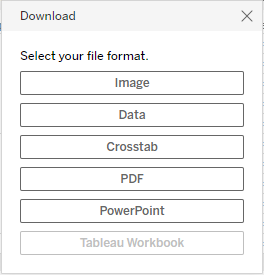
To Download:
- Click "Download" on the bottom right corner (scrolling might be necessary).
- Select your format.