To access Insights, go to https://insights.carexm.com
You will use the same login information that you use to access CXM to log into Insights. This means that if you change your CXM password, it will update in Insights as well.
Your CXM user must have the Analytics toggle turned ON in order to log into Insights.
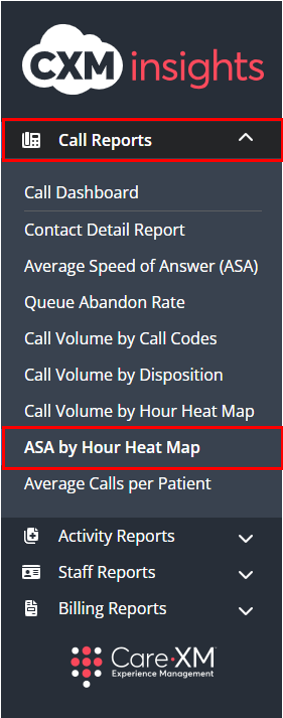
Once logged in, you will be on the landing page and can choose from the different reports by hovering over the category in the left side bar:

Click on Call Reports, then "ASA by Hour Heat Map":
The Average Speed of Answer (ASA) by Hour Heat Map report displays the the length in time in seconds it takes an agent to respond to an Inbound Call. This Heat Map will allow you to find out what particular times of a day ASA spikes, and therefore help with planning staffing for enterprise clients. This Heat Map should also give you the ASA for a given team, average queue duration for Queue Abandon calls only, as well as the ASA for Answered calls only when using the filters appropriately.
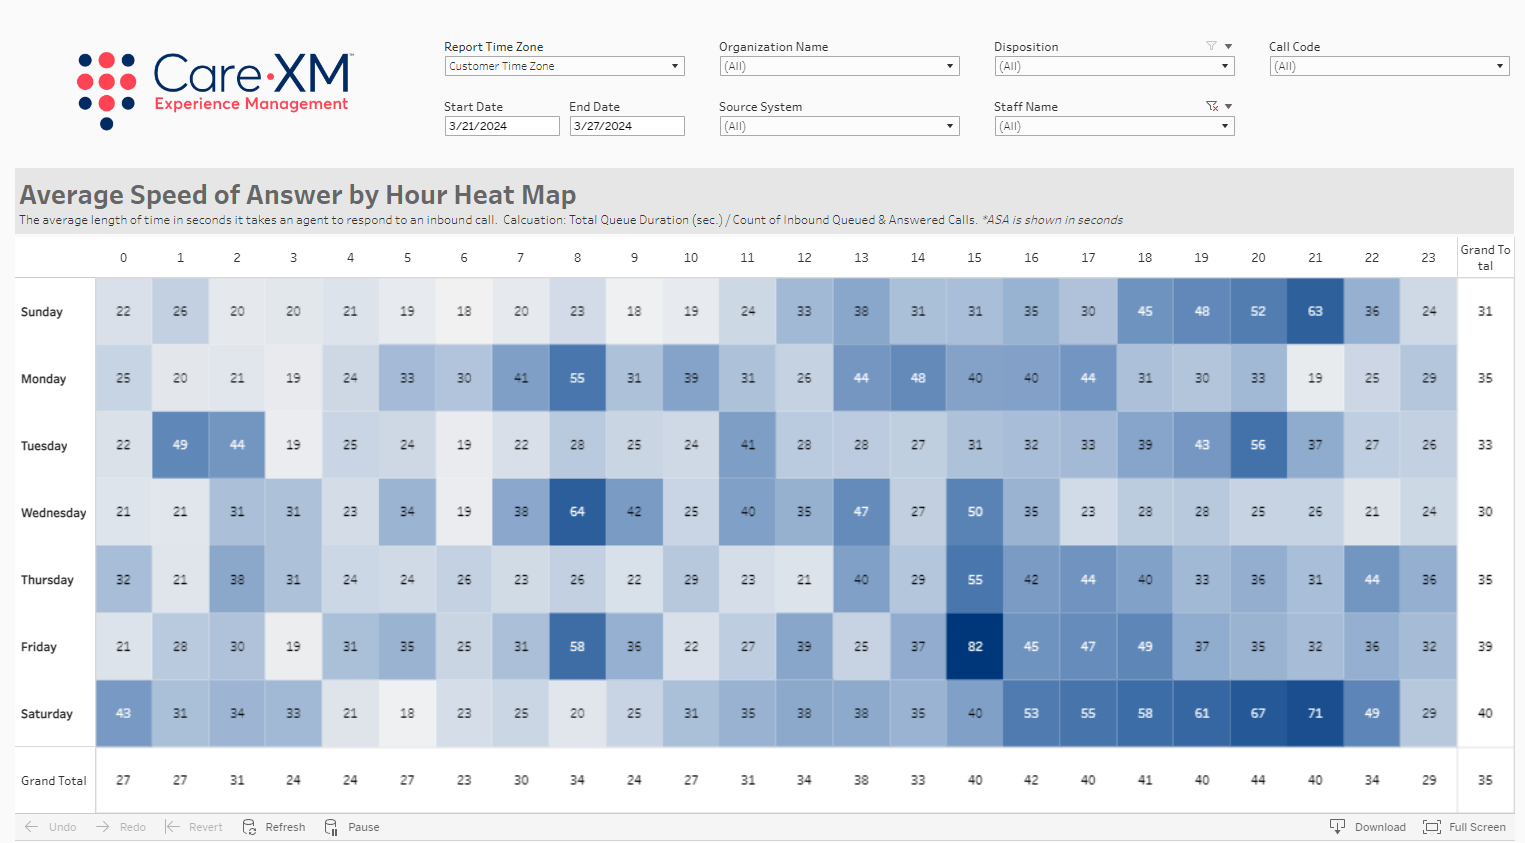
The report can be filtered by Report Time Zone, Organization Name, Disposition, Call Code, Start Date, End Date, Source System, and Staff Name.
- Report Time Zone - This filter will set the time zone of all activities and calls shown on the dashboard to the selected time zone. This filter defaults to selected organization's time zone.
- Organization Name - This filter allows the user to select the organization(s) for which they want to see data. Only Organization(s) that the user has access to AND that have data in the selected time frame will be shown in the filter options.
- Disposition - This list is filtered to show ONLY Queue Abandon and Answered call dispositions as these are the only dispositions used for the ASA calculation.
- Call Code - This filter allows you to select from a list of call codes. This is only relevant for CXM App calls as there are call codes selected in the Total Triage Mobile App.
- Start Date / End Date - These filters allow the user to set the date range for the data shown within the dashboard. The date range is set to the last 10 days by default.
- Source System - This filter allows the user to see only what was created by a specific team. For example, if filtered down to CareTriage, the report would only show data for calls handled by CareTriage.
- By default, this filter will include all Teams selected. The available options shown will be only those relevant to the Organization(s) selected.
- Team Definitions:
- CareAssist - The CXM Non-Clinical Team
- CareTriage - The CXM Clinical Team
- CXM App - The Total Triage Mobile app calls
- CXM - The client's Enterprise Team
- Staff Name -
Note: For report to filter correctly, click on the "Apply" button on the bottom of each filter's drop down. Only applies if the list exceeds 10 options.
The report can be downloaded, select "Download" in the lower right hand corner of the screen:

Choose your file format:
