To access Insights, go to https://insights.carexm.com
You will use the same login information that you use to access CXM to log into Insights. This means that if you change your CXM password, it will update in Insights as well.
Your CXM user must have the Analytics toggle turned ON in order to log into Insights.
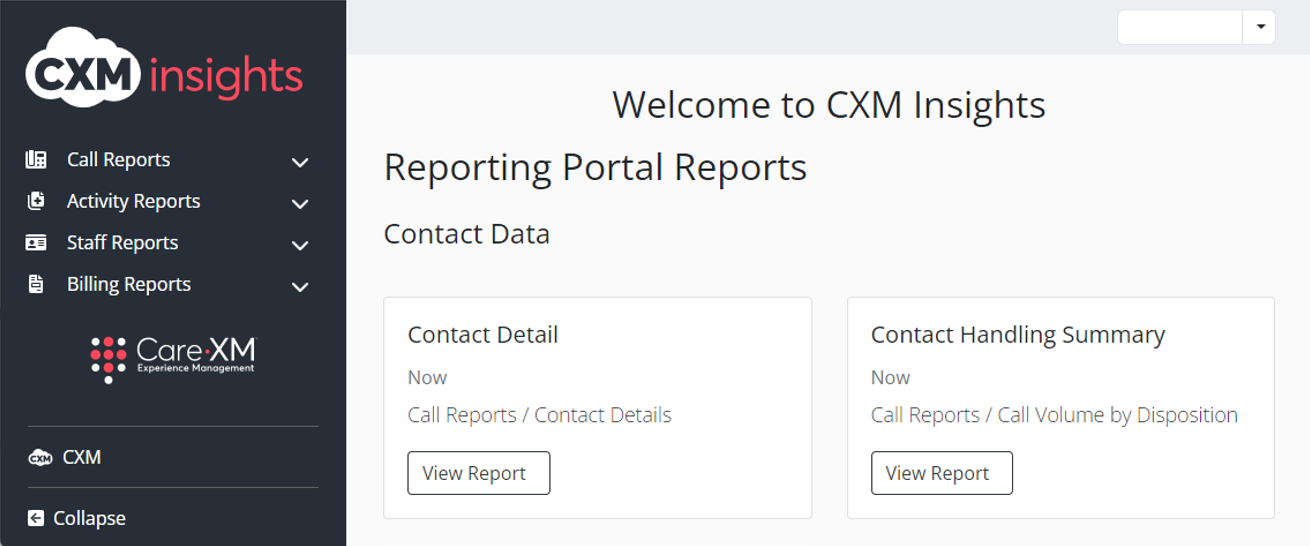
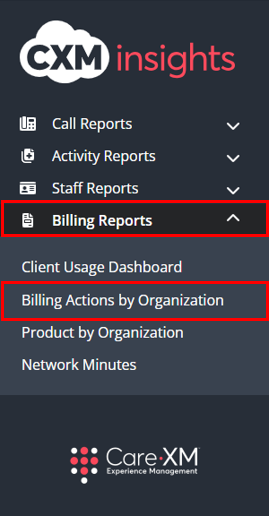
Once logged in, you will be on the landing page and can choose from the different reports by hovering over the category in the left side bar. The category for "Billing Reports" displays data about the billing for your organization:
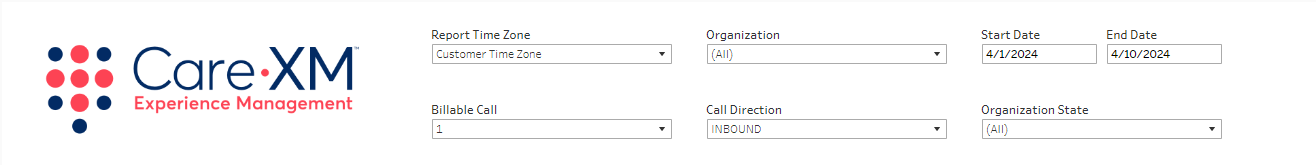
- Report Time Zone: The report will process the data in the user's time zone, to switch time zones, click on the drop down and choose the correct option.
- Organization: This filter allows the user to select the organization(s) for which they want to see data. Only Organization(s) that the user has access to AND that have data in the selected time frame will be shown in the filter options.
- Date Range: The default date range chooses today minus 10 days. To look up a specific date range, manually enter the date.
- Billable Call: The amount of billable calls. Defaults to "All".
- Call Direction: This filter allows the user to select whether they want to see the data for inbound, outbound, or all calls.
- Organization State: This filter allows users to filter the list of Organizations down to those located in the selected geographical state(s). By default, all Organization States will be selected.
Note: For report to filter correctly, click on the "Apply" button on the bottom of each filter's drop down. Only applies if the list exceeds 10 options.

Hover over the data to obtain more detailed information:


The report can be downloaded, select "Download" in the lower right hand corner of the screen, click the name of your organization on the left side of the screen to highlight it in blue and click "download" in the lower right corner of the screen:

Click to turn the organization name blue:

Then download:

Choose your file format:
