To access Insights, go to https://insights.carexm.com
You will use the same login information that you use to access CXM to log into Insights. This means that if you change your CXM password, it will update in Insights as well.
Your CXM user must have the Analytics toggle turned ON in order to log into Insights.
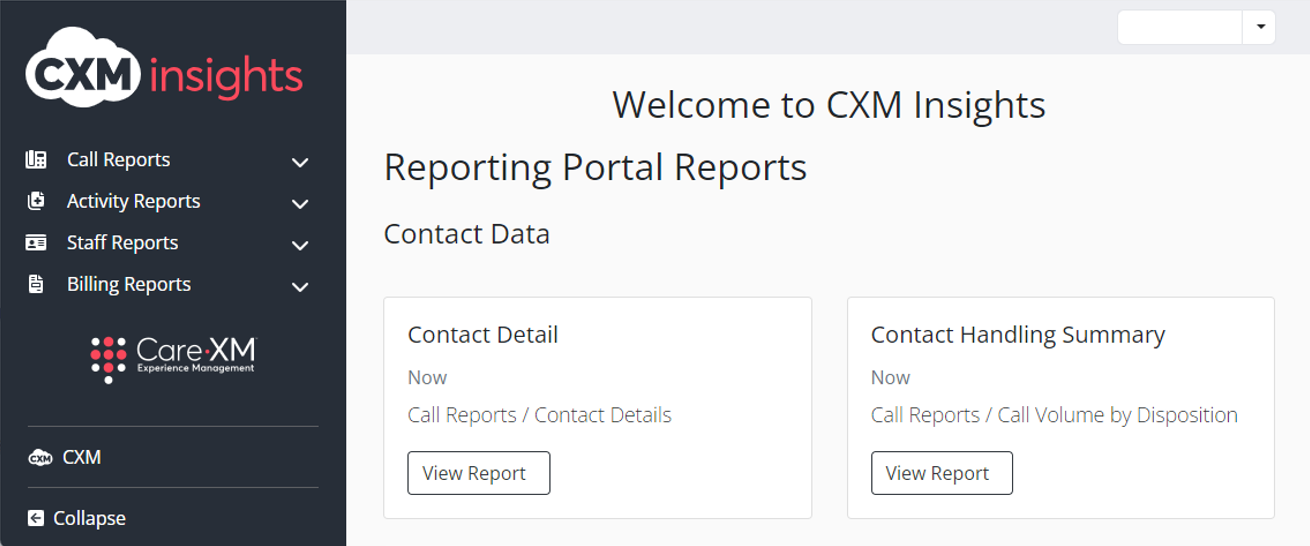
Once logged in, you will be on the landing page and can choose from the different reports by hovering over the category in the left side bar:
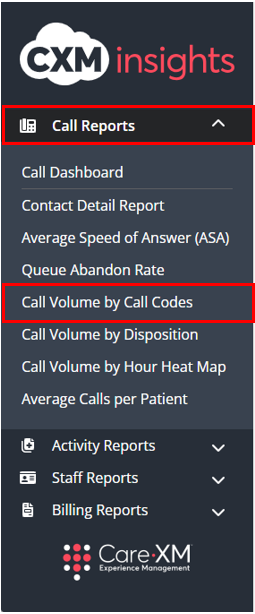
Choose Call Reports, then "Call Volume by Call Codes"
The Call Volume by Call Code report displays the call codes by call volume entered by the client's nurses. It does not display the codes entered by the CareXM nurses.
The report can be filtered by Report Time Zone, Organization Name (Branch, if applicable), Date Range, Call Codes, Call Direction, Staff Name, and Organization State. The report is pulled by default date, which is today minus 10 days.
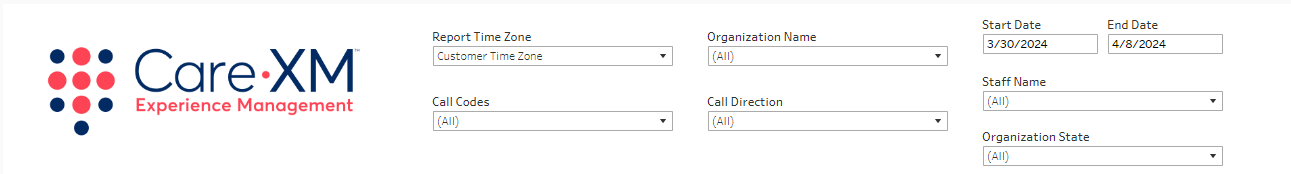
- Report Time Zone: The report will process the data in the user's time zone, to switch time zones, click on the drop down and choose the correct option.
- Organization: This filter allows the user to select the organization(s) for which they want to see data. Only Organization(s) that the user has access to AND that have data in the selected time frame will be shown in the filter options.
- Date Range: The default date range chooses today minus 10 days. To look up a specific date range, manually enter the date.
- Call Code: This filter allows the user to select the primary reason for call.
- Call Direction: This filter allows the user to select inbound or outbound calls. By default, all call directions will be applied.
- Staff Name: This filter allows you to select the name of staff member who took call.
- Organization State: This filter allows users to filter the list of Organizations down to those located in the selected geographical state(s). By default, all Organization States will be selected.
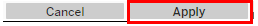
Note: For report to filter correctly, click on the "Apply" button on the bottom of each filter's drop down. Only applies if the list exceeds 10 options.
The top graph shows the Calls Coded and bottom graph shows the Total Calls:
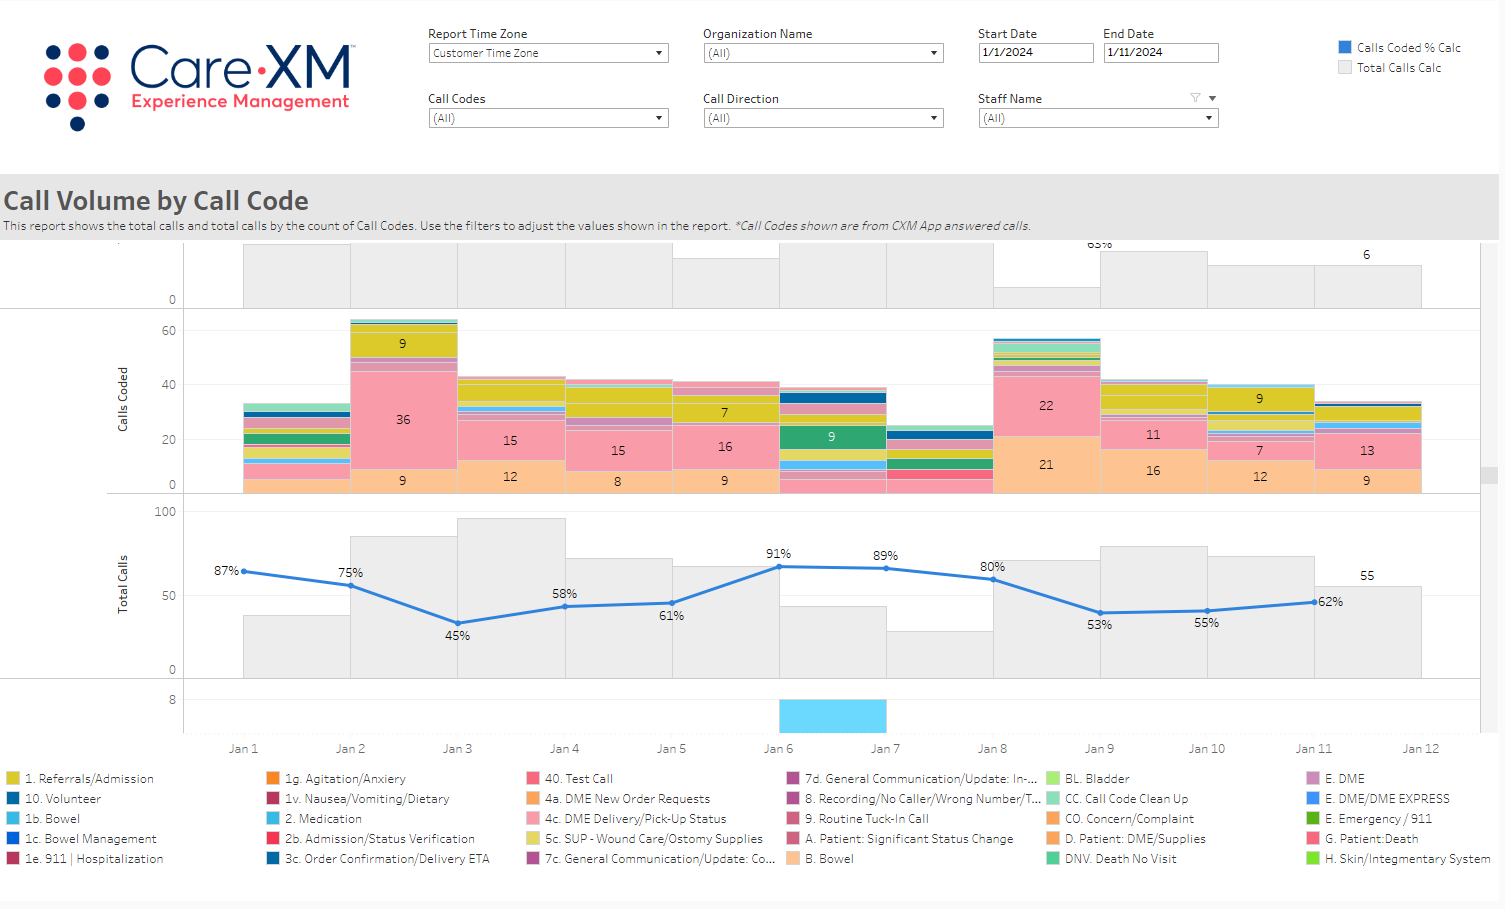
- Calls Coded - Shows the amount of calls coded. Each call code is represented by its own color. Hover over the specific call code for more detailed information about the call code:

- Total Calls - Shows a gray bar graph that represents the total amount of calls that were answered or dialed out from the Total Triage app by Client Users (Staff Members). The Blue line represents the percentage of calls that were coded. Hover over the specific data bar or line for more detailed information:

Use the "-" or "+" button at the lower left of the report to move dates in our out. The zoom lets the user view the data in the selected time frame grouped by day, week, month, quarter or year. Zooming in or out changes which grouping you're using within the time frame you have selected in the filters.

The report can be downloaded, select "Download" in the lower right hand corner of the screen, click the name of your organization on the left side of the screen to highlight it in blue and click "download" in the lower right corner of the screen:

Click to turn the organization name blue:

Then download:

Choose your file format:
