To access Insights, go to https://insights.carexm.com
You will use the same login information that you use to access CXM to log into Insights. This means that if you change your CXM password, it will update in Insights as well.
Your CXM user must have the Analytics toggle turned ON in order to log into Insights.
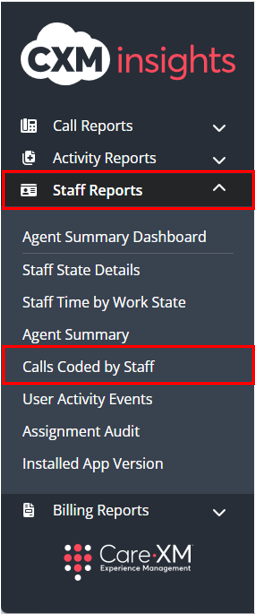
Once logged in, you will be on the landing page and can choose from the different reports by hovering over the category in the left side bar:

Choose Staff Reports, then “Calls Coded by Staff”
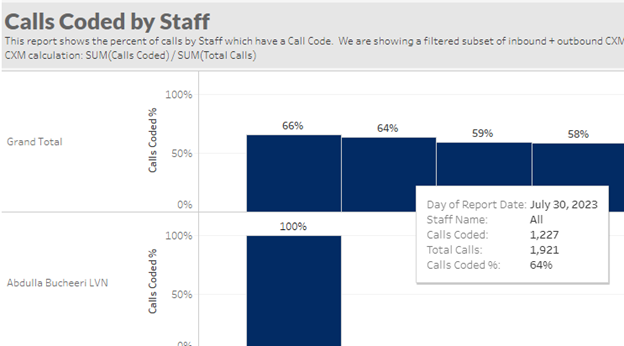
The Calls Coded by Staff report provides a quick way to see the percentage of CXM App Calls where the Staff Member selected a Call Code. This will only show users who handled calls within the Total Triage Mobile App.
The grand total at the top shows the total percentage of calls coded for all selected users and then each user can be seen by scrolling down the window.

This report can be filtered by Report Time Zone, Date Range, Call Direction, Organization Name, Staff Name, and Organization State to allow users to narrow down results to verify Staff compliance with coding calls.
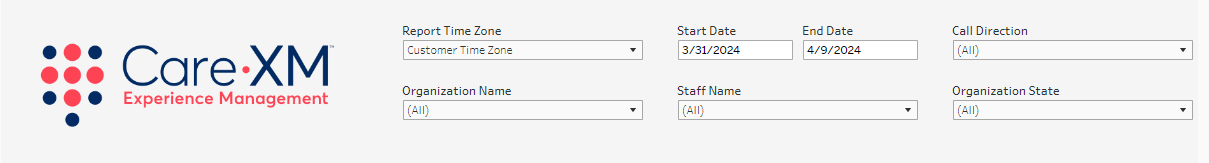
- Report Time Zone: The report will process the data in the user's time zone, to switch time zones, click on the drop down and choose the correct option.
- Date Range: The default date are the previous 10 days. To look up a specific date range, manually enter the date.
- Call Direction: This filter allows the user to select whether they want data on inbound, outbound, or all calls.
- Organization Name: This filter allows the user to select the organization(s) for which they want to see data.
- Staff Name: This filter allows users to select the name of staff member.
- Organization State: This filter allows users to filter the list of Organizations down to those located in the selected geographical state(s). By default, all Organization States will be selected.
Note: For report to filter correctly, click on the "Apply" button on the bottom of each filter's drop down. Only applies if the list exceeds 10 options.
The Blue columns show the Percentage of Calls Coded. By default, this trends day over day, but can be changed to week over week, month over month, etc by using the “+/-“ at the bottom left of the X/Y axis.

The on-hover will show the Date, Staff Name, Count of Calls Coded, Count of Total Calls, and Calls Coded Percent.
How to download:
To download the data as shown in Insights with the counts shown as well as percentages:
1. Click “Download”

2. Click “Crosstab”

3. Select format and choose “Download”
-
- The resulting file will have one row for the grand total of all users, then one row per user grouped by user with one row each for Denominator (total call count), Numerator (Coded Call Count), and the calculation for the percentage of calls coded.
To download the calls coded underlying data (aggregated by user by hour by day, each user will only have counts for the hours they had calls)
1. Click into visualization and then click on a header (i.e. ”Grand total”)
2. Click “Download”
3. Click “Full Data”, then Click “Download all rows as a text file”