To access Insights, go to https://insights.carexm.com
You will use the same login information that you use to access CXM to log into Insights. This means that if you change your CXM password, it will update in Insights as well.
Your CXM user must have the Analytics toggle turned ON in order to log into Insights.
Once logged in, you will be on the landing page and can choose from the different reports by hovering over the category in the left side bar:
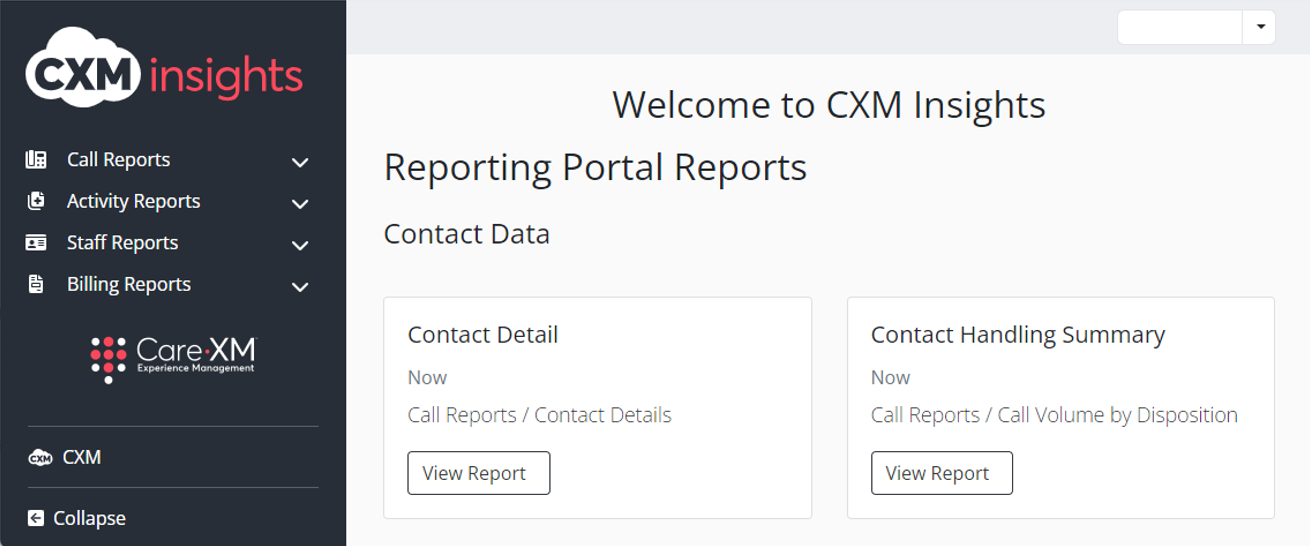
Choose Staff Reports, then “User Activity Events”

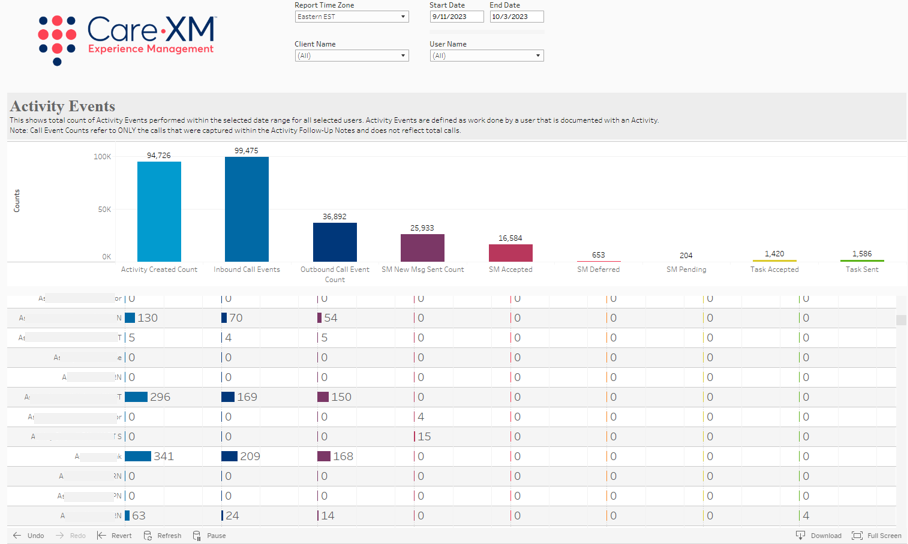
The User Activity Events Report provides a summary view of Activity Events performed by users in the CXM system.
Activity Events are defined as work done by a user that is documented within an Activity.
Using the filters, this report can be filtered to show groups of users who are performing similar job functions to make a quick comparison to gauge Staff productivity over a certain time period. For example, if it is known that a group of users is primarily creating Activities and handling calls, this report could be filtered to show only that group of users by selecting those users in the “User Name” filter. To further narrow down the results, the “Activity Events” filter could be used to filter down to only those Activity Events performed by that group of users.
Note: Call Event Counts refer to ONLY the calls that were captured within the Activity Follow-Up Notes and does not reflect total calls handled within the CXM systems.
This report can be filtered by Report Time Zone, Date Range, Organization State, Client Name, and User Name. Filtering by Client Name will filter down to the Users from those selected Organizations and does not reflect the Organizations in which the Activities were created.
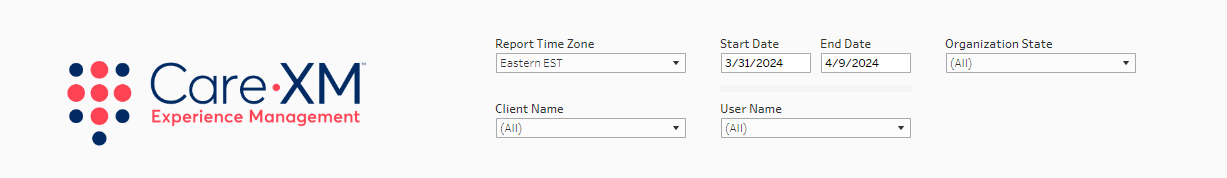
- Report Time Zone: The report will process the data in the Eastern Time Zone, to switch time zones, click on the drop down and choose the correct option.
- Date Range: The default date will show the previous 10 days. To look up a specific date range, manually enter the date.
- Organization State: This filter allows users to filter the list of Organizations down to those located in the selected geographical state(s). By default, all Organization States will be selected.
- Client Name: This filter allows the user to select the organization(s) for which they want to see data. Using this will filter down to the Users from those selected Organizations and does not reflect the Organizations in which the Activities were created.
- User Name: This filter allows users to select the name of staff member(s).
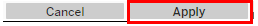
Note: For report to filter correctly, click on the "Apply" button on the bottom of each filter's drop down. Only applies if the list exceeds 10 options.
The top section shows the total number of each Activity Event performed by the selected user(s) in the selected time period. This report defaults to showing the previous 10 days.

The bottom section shows the total number of each Activity Event performed by the individual users.

The bars within each cell will expand to reflect a higher number of that particular Activity Event being performed as compared to the other Users selected in the filter.

The Activity Events shown in this report are defined as follows:
▪ Activities Created Count – This represents the count of Activities created by the selected user(s).
▪ Inbound Call Events (IB) – This represents the total number of Activities Created plus the number of Inbound Call Events created by the selected user(s). This does NOT include the initial inbound call that triggered the activity to be created but represents only the number of additional Inbound Call Events added to a previously existing activity. These events are triggered when a staff member selects a Follow Up Note type of ‘Client Staff – Inbound’ or other Inbound call type. This includes only Inbound Call events created on the Activity in the Follow-up Notes and does not include all Inbound Calls taken by that user. The total number of Inbound calls taken by that user can be found within the Contact Detail Report.
▪ Outbound Call Events (OB) – This represents the count of Outbound Call Events created by the selected user. This only includes Outbound Calls that were created as an event either by using the click-to-dial within the activity or by creating a Follow-up note with and Outbound Call type. This does not represent outbound calls that were not documented within the activity. The total number of Outbound Calls made by a user can be found within the Contact Detail Report.
▪ Secure Messages Sent – This represents the number of Secure Messages sent from the web – from an activity - by the selected user. This does not include messages sent app to app by users, only Web to App messages. This only includes the actual message being sent and does not include ‘reminder’ messages.
▪ Secure Messages Accepted – This represents the number of Secure Messages that the selected user(s) chose an ‘Accept’ response for in the Total Triage Mobile App.
▪ Secure Messages Deferred – This represents the number of Secure Messages that the selected user(s) chose an ‘Defer’ response for in the Total Triage Mobile App.
▪ Secure Messages Pending – This represents the number of Secure Messages that the selected user(s) chose an ‘Pending’ response for in the Total Triage Mobile App.
▪ Tasks Accepted – This represents the number of Tasks the selected user(s) accepted.
▪ Tasks Sent – This represents the number of Tasks the selected user(s) sent.
How to download individual user counts:
To download the User Data in the format seen within Insights (as a total by user for the entire selected time period):
1. Click “Download” at the bottom right of the page

2. Select “Crosstab”

3. Make sure the “User Activity Events” box is selected and choose your preferred format of Excel or CS, then click “Download”

To download the User Data with the time period broken out into the total number of actions performed by each user by hour for each day of the selected time period:
1. Click into the bottom Visualization and then on the blank space in the top right corner - this tells Tableau which data you want to download (in this case the whole table) 
2. Click “Download”

3. Select “Data”

4. In the prompt that opens, click “full data”

5. Click “Download all rows as CSV”
a. The resulting file will show the count of each Activity Event performed by Hour for each day for each user over the selected time period.